[ad_1]
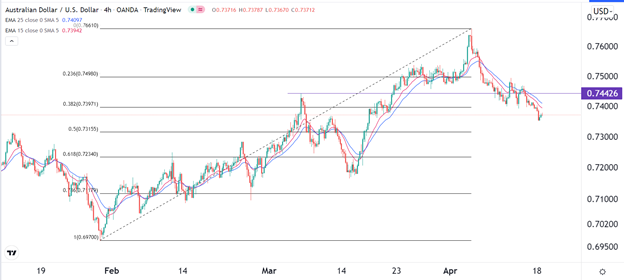
The path of the least resistance is lower as sellers target the 50% Fibonacci retracement level at 0.7315.
Bearish View
- Sell the AUD/USD and set a take-profit at 0.7300.
- Add a stop-loss at 0.7425.
- Timeline: 1 day.
Bullish View
- Add a buy-stop at 0.7400 and a take-profit at 0.7500.
- Set a stop-loss at 0.7300.
The AUD/USD pair slipped to the lowest level since March 17th as investors reacted to the latest economic data from China. It dropped to a low of 0.7352, which was about 4% below the highest point this month.
China Economic Slowdown
The Australian and Chinese economies have a close relationship. China buys most of Australia’s commodities like copper, coal, and iron ore. At the same time, many Chinese students go to study in Australia. Therefore, investors tend to look at Chinese data to predict the health of the Australian economy.
Data published by the Chinese government showed that the country’s economy expanded by 4.8% in the frst quarter compared to the same period in 2021. The economy expanded by 1.3% on a quarter-on-quarter basis. These numbers were better than what analysts were expecting.
However, other closely watched data revealed that the economy was starting to struggle as the Covid-19 pandemic continued. For example, retail sales declined 3.5% in March. This was the first YoY decline since July 2020. The unemployment rate also rose from 5.5% to 5.8%.
The AUD/USD also declined after the RBA published minutes of the previous meeting. In this month’s meeting, officials left interest rates unchanged and signaled that they were losing patience with the ongoing trends on inflation. The officials expect that the country’s economy will continue doing well in the coming months. As a result, most analysts believe that the bank will start hiking interest rates in June meeting.
The AUD/USD pair fell as America’s bond yields continued rising. The 10-year yield rose to 2.81% while the 30-year rose to 2.9%. The two-year rose to 2.45% as investors waited for the American building permits and housing starts data.
AUD/USD Forecast
The four-hour chart shows that the AUD/USD pair has been in a strong bearish trend in the past few days. The pair has managed to move below the important level at 0.7442, which was the highest point on March 7th. It also declined below the 38.2% Fibonacci retracement level. Further, the pair moved slightly below the 15-period and 25-period moving averages.
Therefore, the path of the least resistance is lower as sellers target the 50% Fibonacci retracement level at 0.7315. This view will be invalidated if the price moves above the key resistance at 0.7445.

[ad_2]

