[ad_1]
Bitcoin will likely continue its bearish trend as sellers attempt to move below $20,000.
Bearish View
- Sell the BTC/USD pair and set a take-profit at 19,500.
- Add a stop-loss at 21,500.
- Timeline: 1-2 days.
Bullish View
- Set a buy-stop at 21,300 and a take-profit at 23,000.
- Add a stop-loss at 20,000.
The BTC/USD pair retreated slightly as demand for Bitcoin and other cryptocurrencies waned. Bitcoin dropped from last week’s high of $21,846 to a low of $20,700. This price is about 18% above the lowest level this month.
Bitcoin and Stocks Waver
Bitcoin retreated in the overnight session as investors watched the performance of the stock and bond market.
In the United States, the Dow Jones index declined by 80 points while the Nasdaq 100 fell by more than 80 points. This was a sharp reversal considering that stocks rose sharply on Friday last week. Stocks have a close correlation to cryptocurrencies recently.
Meanwhile, Bitcoin pulled back as the bond market continued its sell-off. The yield of the 10-year government bonds rose to 3.20% while the 30-year rose to 3.145%. Bond yields have an inverse relationship with prices.
This performance is mostly because of the hawkish tone by the Federal Reserve. The bank has already hiked interest rates by 150 basis points this week and analysts expect that it will continue hiking in the coming months. It has also started implementing quantitative tightening.
The BTC/USD pair also wavered as demand from retail and institutional investors remain under pressure. The number of new account openings has dropped sharply in the past few days. Similarly, Bitcoin funds have seen significant outflows during the sell-off. The number of Bitcoin accounts has been dropping.
Further data shows that Bitcoin’s put to call ratio is hoverning near its highest level this year. A high ratio is usually a sign that more investors are placing bearish trades in the options market. In contrast, Ethereum has seen its ratio drop to the lowest level since January this year.
BTC/USD Forecast
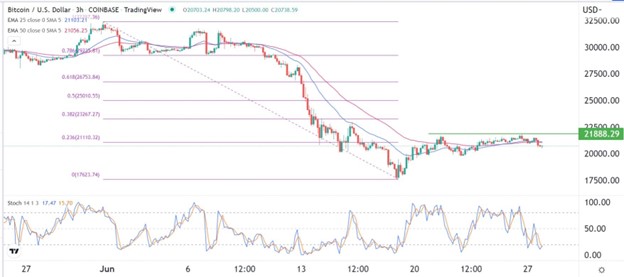
The three-hour chart shows that the BTC/USD pair has been moving sideways in the past few days. This is a sign that bulls have struggled pushing the pair above last week’s high of 21,888. It has moved slightly below the 25-day and 50-day moving average. Bitcoin has also moved below the 23.6% Fibonacci Retracement level while the Stochastic Oscillator has moved to the oversold level.
Therefore, after facing substantial resistance, Bitcoin will likely continue its bearish trend as sellers attempt to move below $20,000. On the flip side, a move above the resistance at 21,888 will signal that bulls have prevailed and push it higher.

[ad_2]

